

Analytics & Visualization
Dashboards, KPI tracking, GA4/GTM setup, marketing reports, operational reporting, and executive visibility.
Let’s plan your projectA clear scope. A useful outcome.
Useful reporting starts before a chart is drawn. We align source systems, definitions, access, and quality checks so dashboards and AI features are built on data your team can explain and maintain.
For analytics & visualization, we define the first useful deliverable, the systems it depends on, and how your team will review the result.
Connect measurement to business questions
Start with the questions the reporting should answer. Define events and KPIs, then implement tracking around consent and the actual customer journey.
- Event and KPI planning
- GA4 and GTM implementation
- Consent-aware tracking design

Make the signal easier to read
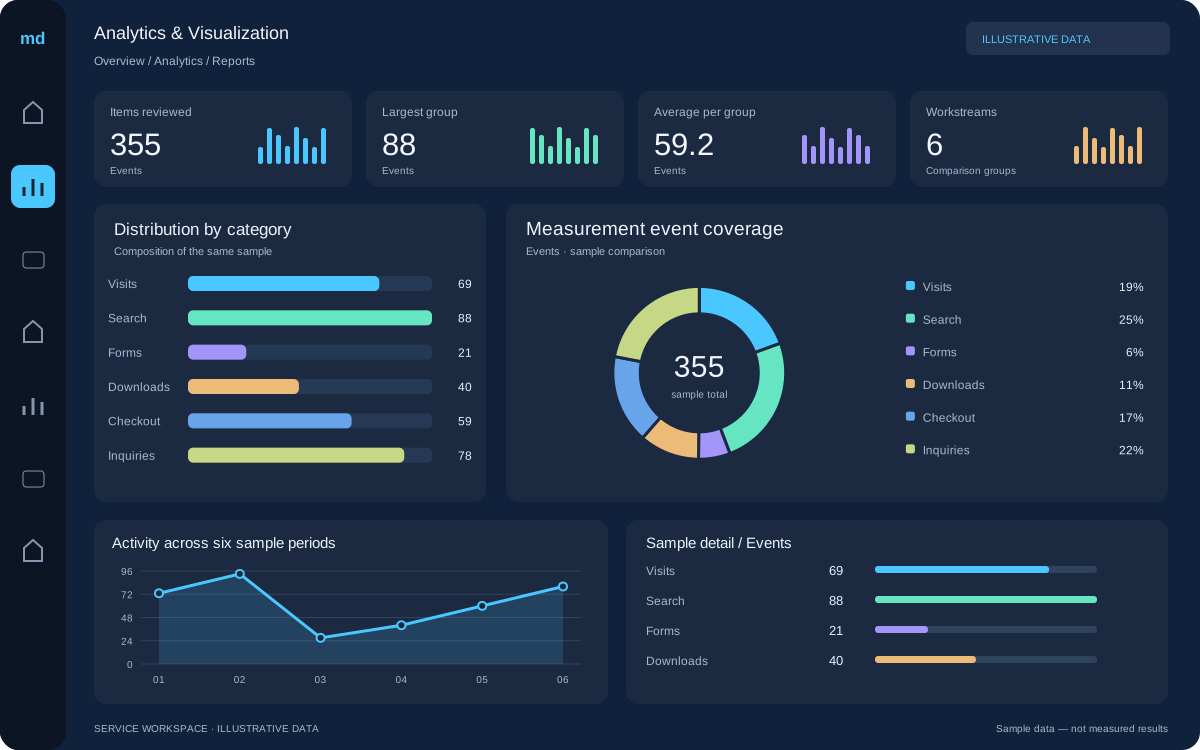
Choose views that make patterns and comparisons clear. Filters, chart labels, and accessible presentation help users interpret the information correctly.
- Marketing and operational dashboards
- Filters and comparison views
- Accessible chart presentation
Check the quality behind each view
Validate the collection and refresh process behind the dashboard. Document assumptions and known gaps so readers understand the limits of the analysis.
- Event and source validation
- Reporting refresh checks
- Analysis and handoff documentation

Work with the systems
you depend on.
We review interfaces, permissions, data ownership, and platform limitations before connecting tools. Each handoff includes validation, error handling, and a clear owner.
Make room for
higher-value work.
Start with a defined decision or task, assess the available data, and compare the model with a useful baseline. Build evaluation, source permissions, and review into the workflow.
Explore an opportunity ↗Choose a bounded task
Define the input, expected output, and decisions that stay with people.
Validate with real scenarios
Test representative cases and plan how exceptions reach your team.
Improve from evidence
Review quality, operating cost, and usefulness before expanding.
From first conversation to a working result.
Clear milestones and review points keep the work connected to your goals.
Discover
Review the current workflow, goals, constraints, and available evidence.
Define
Agree the scope, acceptance criteria, responsibilities, and delivery plan.
Deliver & validate
Work in reviewable stages, check the result, and resolve issues before handoff.
Launch & improve
Prepare documentation, confirm ownership, and plan improvements from real use.
Analytics & Visualization FAQs.
Let’s make the scope and next steps clear.
Ask about your project ↗What is included in Analytics & Visualization?
Dashboards, KPI tracking, GA4/GTM setup, marketing reports, operational reporting, and executive visibility. We agree the deliverables, exclusions, and acceptance criteria during discovery so the engagement has a clear scope.
What should we bring to the first conversation?
Share your goals, current tools, and an example of the workflow you want to improve. For this service, useful starting points include event and kpi planning, ga4 and gtm implementation, and consent-aware tracking design.
Can you work with our existing team and systems?
Yes. We review the current environment, access requirements, and internal responsibilities before recommending changes. The delivery plan can include collaboration with your team, documentation, and knowledge transfer.
How are timelines and ongoing support agreed?
We estimate the work after reviewing scope, dependencies, and access. Milestones, review checkpoints, support hours, and response targets are agreed for the engagement; they are not assumed from the service name.
Data Analytics in focus.
A closer look at the collaboration and practical work behind the digital experience.




Illustrative service photography.
What would you like to improve?
Bring us the challenge. We’ll help you shape a practical scope.
Talk to Media Decoding ↗